Vodafone Idea Ltd | Triangle Pattern Formation | Stocks For Your Watch List
 Yagnesh Patel

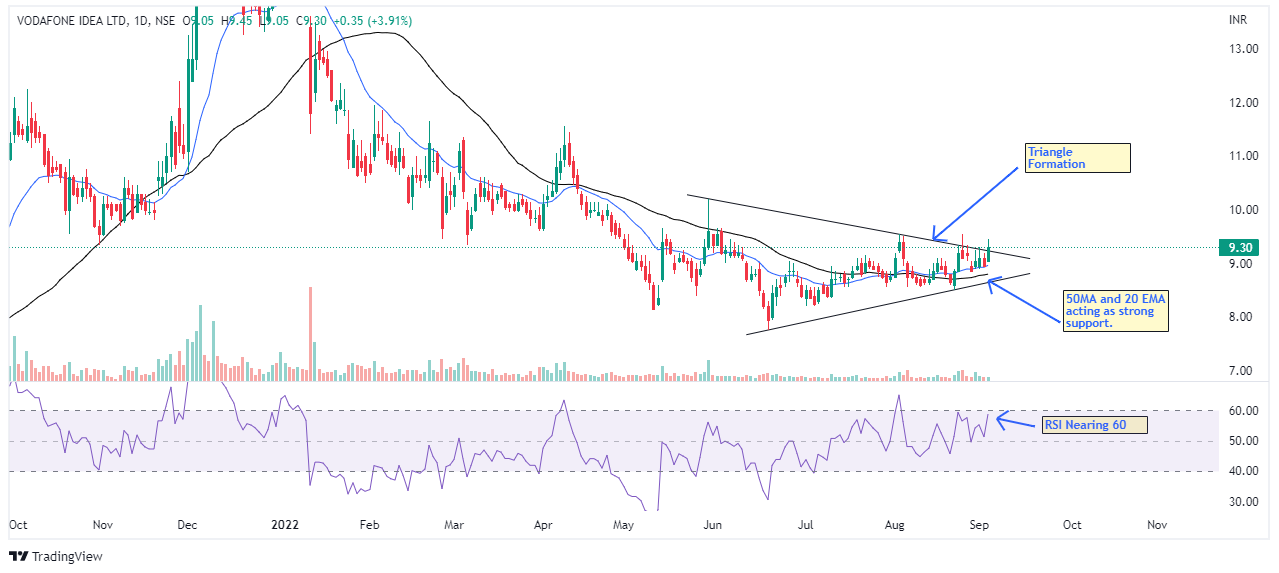
Stock: Vodafone Idea Ltd
Indicator: 55MA, 20EMA & RSI
Chart pattern: Triangle pattern
Time frame: Daily
Vodafone idea exhibiting triangle pattern formation on daily time frame. We are also witnessing that prices have taken support on 55MA and 20EMA nicely. RSI also approaching 60, if we see candle breaking out of triangle pattern with significant volume we can expect price to show further up move.
We would recommend you to keep this stock on watch List as see how price action moves.
Now get the benefit of premium swing trades with "Ultra Premium Stock Watch". Some of the best hand picked swing trades, good for adding to your short term portfolio. Check out more details here: https://rigipay.com/g/5lThdPzpLF

Disclaimer: This blog is created just for learning purpose, which would help you understand how to analyze stocks before taking trades. This is not any buy and sell recommendation, the author of this post is not responsible for any profit or loss incurred. Please consult your financial advisor before making investments.
Categories: : Stocks For Watchlist